
DrainRisk: AI-powered culvert prioritisation
DrainRisk: Dashboard
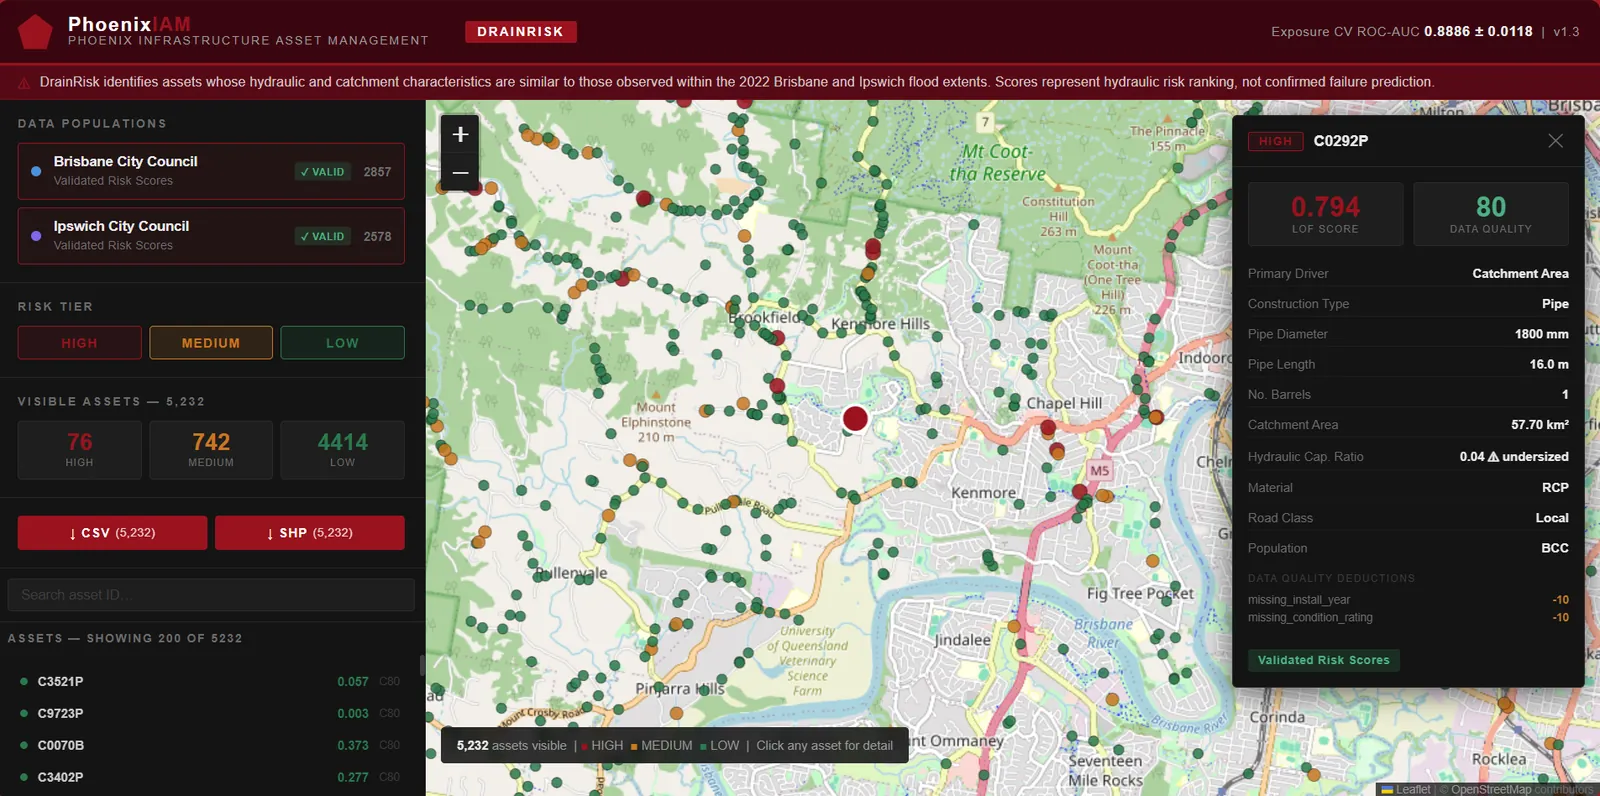
DrainRisk is an AI model that ranks which culverts to prioritise for inspection and maintenance. It combines a flood-exposure model with a hydraulic capacity check, so a culvert is rated HIGH only when it is both flood-prone and undersized. Each culvert comes with its scores and a confidence rating, so the ranking can be explained and defended.
DrainRisk identifies assets whose hydraulic and catchment characteristics are similar to those observed within the 2022 Brisbane and Ipswich flood extents. Scores represent hydraulic risk ranking, not confirmed failure prediction. Hydraulic adequacy is assessed against the engineering standard of design storm capacity, whether the culvert can handle the 10% AEP design flow.
DrainRisk: How it works
-
Asset Register
Pipe geometry, diameter, material, construction type. Data your council already holds.
-
Public Data Layers
BoM rainfall intensity, GA terrain elevation, land use imperviousness, road classification.
-
Hydraulic Analysis
Catchment area, hydraulic capacity ratio, and height above nearest drainage computed per asset.
-
Two-Stage AI Scoring
Exposure model: is this location flood-prone? Adequacy model: can the pipe handle the flow? Both answered independently.
-
Ranked Output
HIGH / MEDIUM / LOW risk tier, exposure and adequacy scores, and a confidence score on every asset.
Model Features
Two models, each using different inputs. No feature is used in both.
Flood exposure model (7 features)
- Upstream catchment area
- Rainfall intensity (BoM IFD, 10% AEP)
- Catchment slope
- Height above nearest drainage (HAND)
- Land-use imperviousness
- Pipe length
- Road classification
Hydraulic adequacy model (7 features)
- Hydraulic capacity ratio (log scale)
- Number of barrels
- Pipe diameter
- Construction type (box or pipe)
- Box culvert span
- Box culvert height
- Pipe material
Risk Tier Output
| HIGH | MEDIUM | LOW |
|---|---|---|
| Flood-exposed AND undersized. Combined score 0.70 or above, with both checks passed. Priority inspection. | Combined score 0.40 to 0.70. A moderate or single-dimension signal. Monitor and schedule inspection. | Combined score below 0.40. Lower priority. |
- HIGH
Flood-exposed AND undersized. Combined score 0.70 or above, with both checks passed. Priority inspection.
- MEDIUM
Combined score 0.40 to 0.70. A moderate or single-dimension signal. Monitor and schedule inspection.
- LOW
Combined score below 0.40. Lower priority.
Every culvert also receives an exposure score, an adequacy score and a confidence score out of 100 reflecting data completeness. Missing fields lower the confidence score and are flagged against the asset.
Evidence
Tested on 5,435 Brisbane and Ipswich culverts.
-
0.8886
Cross-validated AUC
Five-fold cross-validation of the flood exposure model.
-
16 of 16
Ipswich HIGH-tier culverts inside the January 2011 flood
A flood the model was not trained on. Share of Ipswich culverts inside the flood extent, by tier.
-
531
Culverts too small for the design flood
9.8% of the 5,435 culverts cannot carry the 10% AEP design flow.
Partner with us
We work with engineering firms that deliver asset management and stormwater work for councils. If you would like to offer DrainRisk assessments as part of your services, or white-label them under your own reporting, get in touch.
Enquire about a partnership